This is a new series of product-focused blogs to help our customers achieve even greater ROI with LevelEleven. To view other stories in the series, click here.
Last week, we launched a powerful new feature within the LevelEleven Scorecard product: a sales KPI grid called Activity Overview.
Like many of the capabilities within our system, this was inspired by feedback from our amazing customer community. You told us that you needed a quick snapshot of the goals for your team and where each rep stands against them. So we built it.
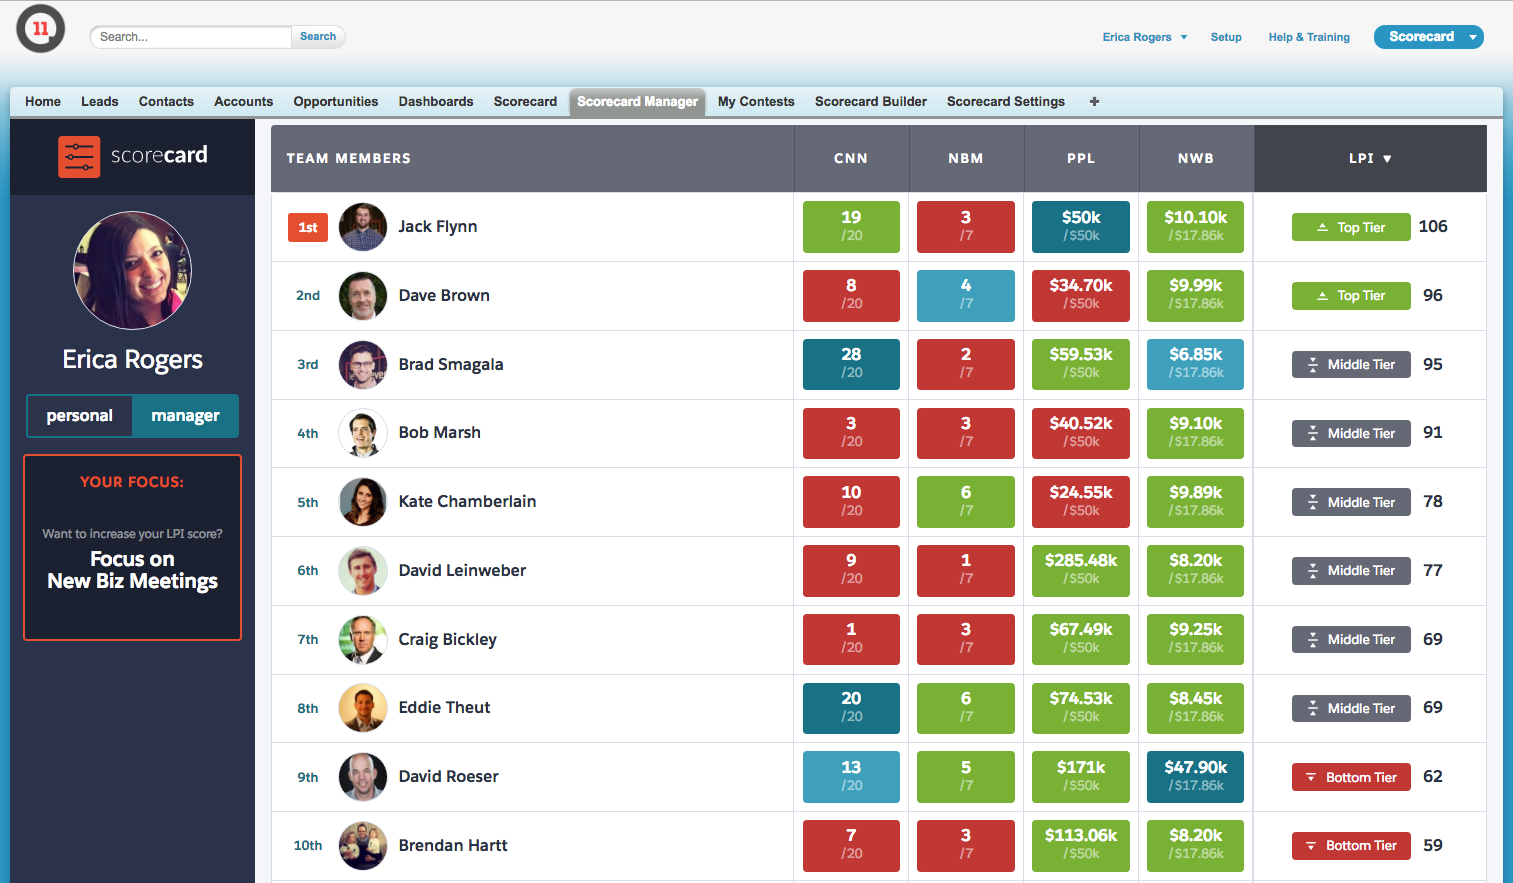
The Activity Overview is a single, simple view that a VP or manager can use to see their four key sales KPI metrics as column headers with each rep’s current period performance below.
This instant performance snapshot also ranks everyone on your team by their LevelEleven Performance Index score (a proprietary algorithm that measures a rep’s holistic performance against his or her goals). With Scorecard Mobile, you can even access the Activity Overview at any time while on the go.
This sales KPI grid can be used in a number of different ways to increase sales performance. Here are just a few.
3 ways to increase sales with your Activity Overview sales KPI grid
1. Identify trends across the entire team.
A best practice we recommend is to design your metrics to follow the order of your sales process. For an inside sales team, that order might be 1) connect with a prospect 2) have a meeting 3) send a proposal 4) close deal.
The metrics in the image below reflect that process and are presented as Connects, New Biz Meetings, Pipeline and Wins. This helps you view activity across your sales funnel from the top of the funnel (metrics on the left) to the bottom of the funnel (the metrics on the right).
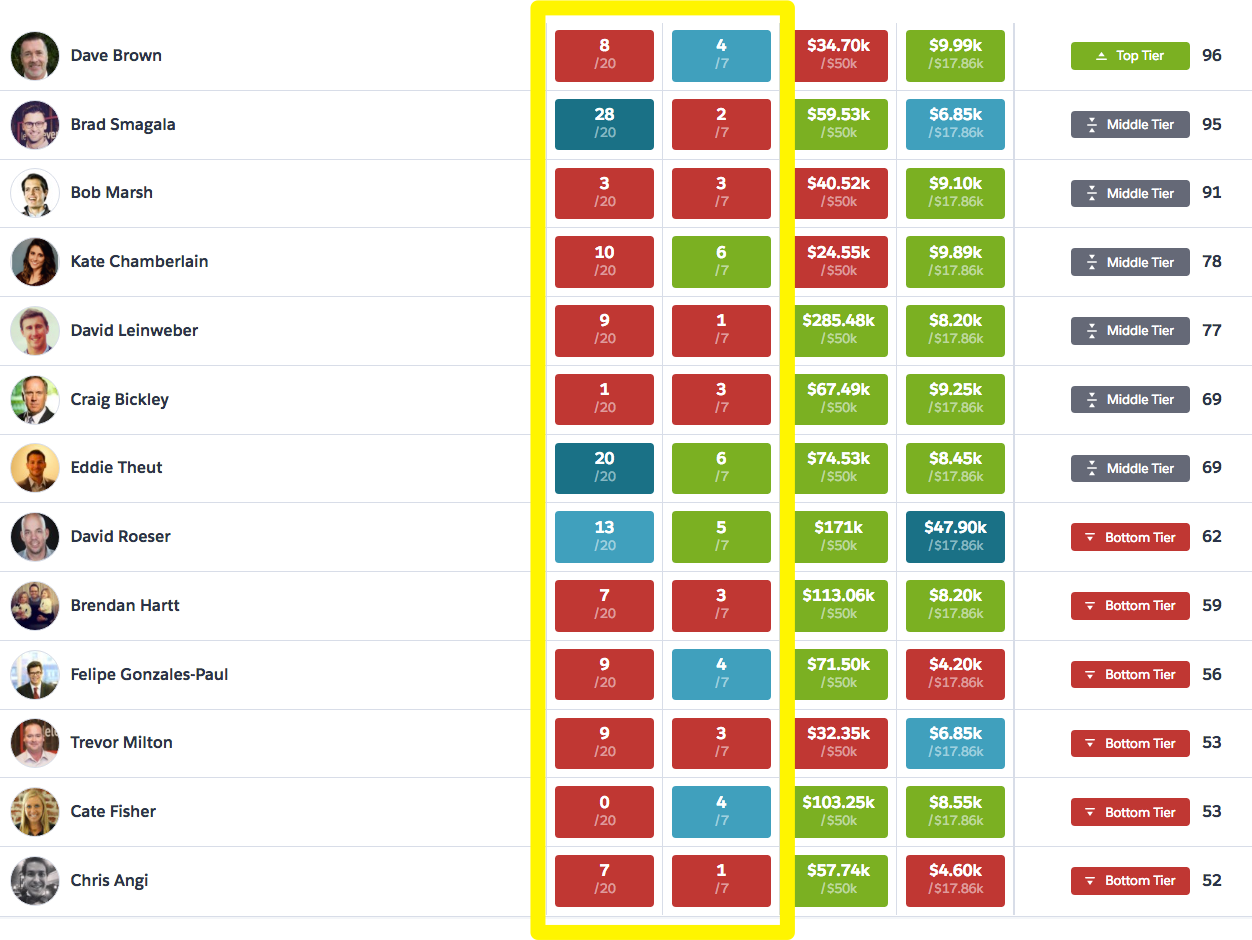
The Activity Overview’s color-coding enables you to easily spot trends. Metrics that are behind pace appear in red; metrics that are on pace appear as blue; metrics that are ahead of pace appear in green; and metrics that are completed are a darker blue. When you notice a lot of red across the team on either one metric or a certain part of the funnel, course-correct accordingly.
Hold a group coaching or peer mentoring session around top-of-funnel activities. Use ContestEngine to put together a quick spiff and rally your team around getting those metrics back on pace.
2. Boost individual rep performance.
When you want to take a deeper dive into the sales KPI data for any rep, simple click on their row within the team member list. A drop-down will appear with this rep’s individual primary and secondary metrics. 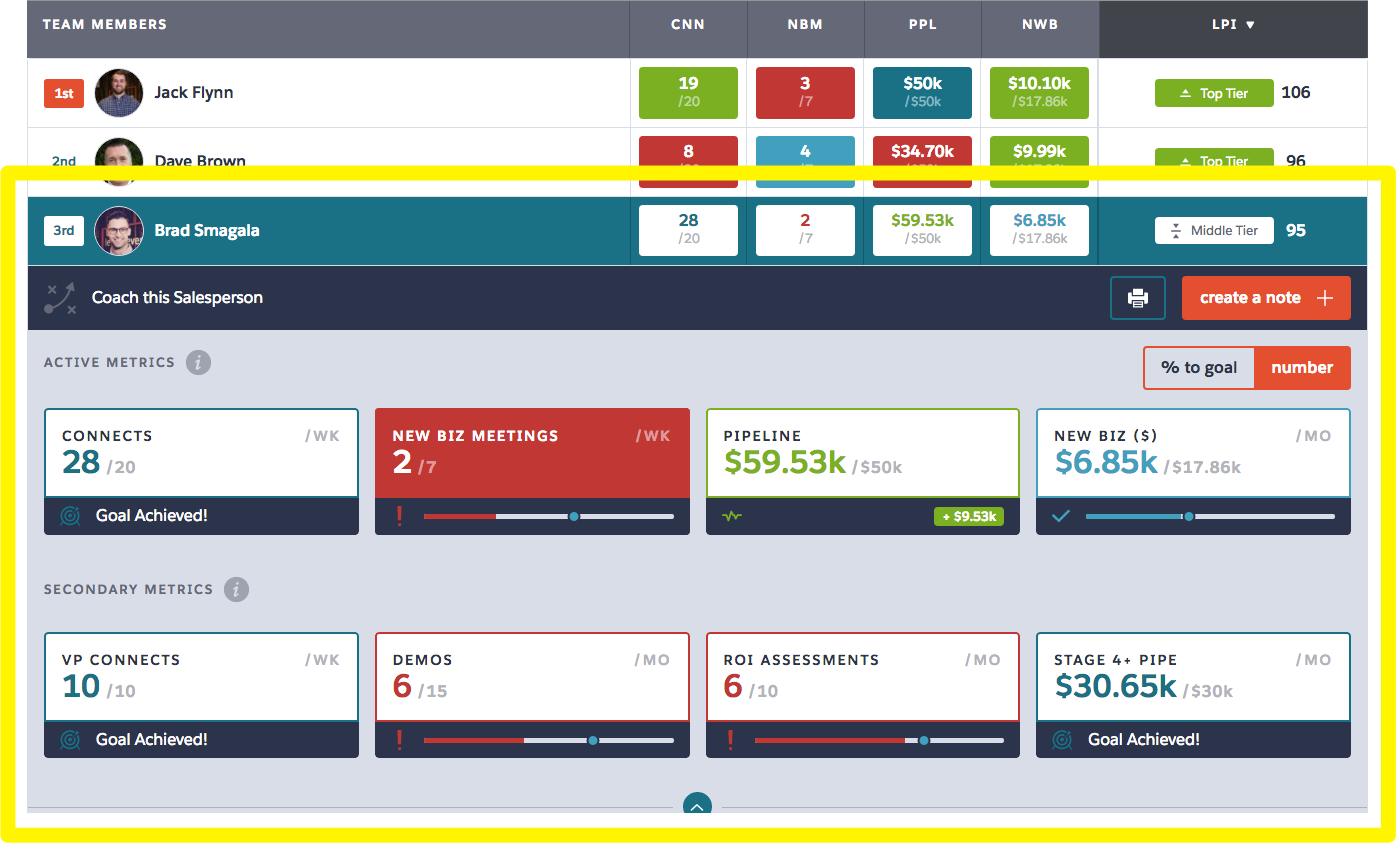
From here, you can identify which metrics a top performer can mentor their peers around. In the example shown above, the rep has achieved their Connects and VP Connects goal, so he might be a good candidate to source best practices from.
This same rep is behind on his New Biz Meetings, Demos and ROI Assessments goals. But his Pipeline, New Biz and Stage 4+ Pipe are on track or ahead of pace. This could mean that he is having trouble converting connects into meetings, or he simply hasn’t been spending enough time on getting more demos and ROI assessments. Either way, it’s a good opportunity to coach, which brings us to our last recommendation …
3. Initiate coaching sessions right within Salesforce.
If you have the LevelEleven Coaching add-on, you’ll see an option in the individual drop-down view to “Coach this Salesperson.”
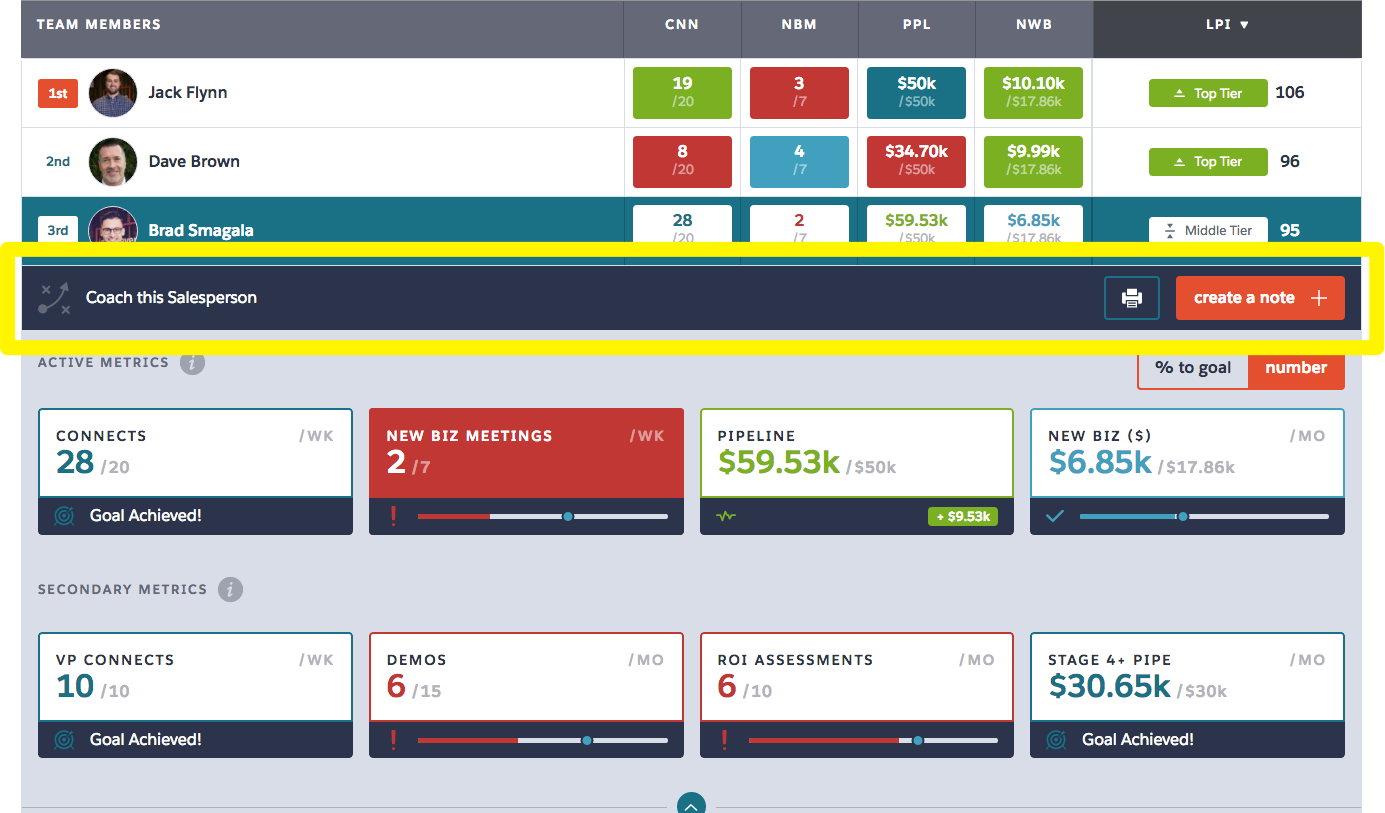
Once you decide how and what you’re going to coach the rep around, you can initiate a coaching conversation right from this page. You’ll immediately be taken to our coaching module, which snapshots Scorecard data so sales managers can coach with consistency, record one-on-one sessions and assign action items all within Scorecard.
These are just a few ways to accelerate performance with your Activity Overview. To learn more about how to get the most from your Activity Overview, click here. Not a LevelEleven customer, yet? Start here!
Interested in learning how today’s top sales teams are driving revenue with sales KPIs? Grab a copy of the 2017 Sales KPI report below.